
Height Calculator
Predict adult height with three methods, compare percentile position on a growth curve, and convert height instantly between imperial and metric units.
Calculator Inputs
Used for Khamis-Roche, Paley multiplier, and percentile plotting.
lb
Formula + logic
People used this calculator
Your current platform: --
This total is global for all users (desktop and mobile) using this calculator on calculatorgeek.com.
Height Calculator: Convert, Compare & Predict Height
Height Calculator: Convert, Compare & Predict Height
Quick Answer: This tool converts height between feet/inches and centimeters instantly, compares a person’s height to typical age-based growth patterns using CDC/WHO data, and estimates a child’s future adult height using the mid-parental and Khamis-Roche methods. Predictions are estimates with a margin of error of roughly ±4–8 cm, not guarantees.
Last updated: [insert date] · Reviewed by: [insert credentialed reviewer name/title — see implementation notes]
A height calculator helps you do three things people actually care about: convert height units, compare height with typical age-based growth patterns, and estimate future height using established prediction methods. Whether you’re filling out a school form, checking a sports profile, tracking growth at home, or simply curious, this page gives you quick results with the context to interpret them correctly.
CalculatorGeek’s height tool is built as a complete height hub:
- Understand what affects height — genetics, sleep, nutrition, and growth timing
- Convert feet/inches to centimeters (and back) in seconds
- Compare results with growth charts (median vs. mean trends)
- Predict a child’s possible adult height using parent-based and clinical estimation methods
Related tools: BMI Calculator
Convert Height Between Feet, Inches, and Centimeters
Most people use a height calculator because different systems are used in different places — medical forms, school records, sports profiles, or international documents. This tool accepts height naturally and returns an exact result without rounding errors.
The converter:
- Accepts feet and inches together (not just decimal feet)
- Converts instantly to centimeters
- Displays results clearly and consistently
Conversion standards used:
- 1 inch = 2.54 centimeters
- 1 foot = 12 inches = 30.48 centimeters
These values are internationally standardized (SI/imperial conversion definitions) and ensure consistent results across devices and platforms.
Common Height Conversions (Quick Reference)
| Height | Centimeters |
|---|---|
| 5’0″ | 152.4 cm |
| 5’4″ | 162.6 cm |
| 5’8″ | 172.7 cm |
| 6’0″ | 182.9 cm |
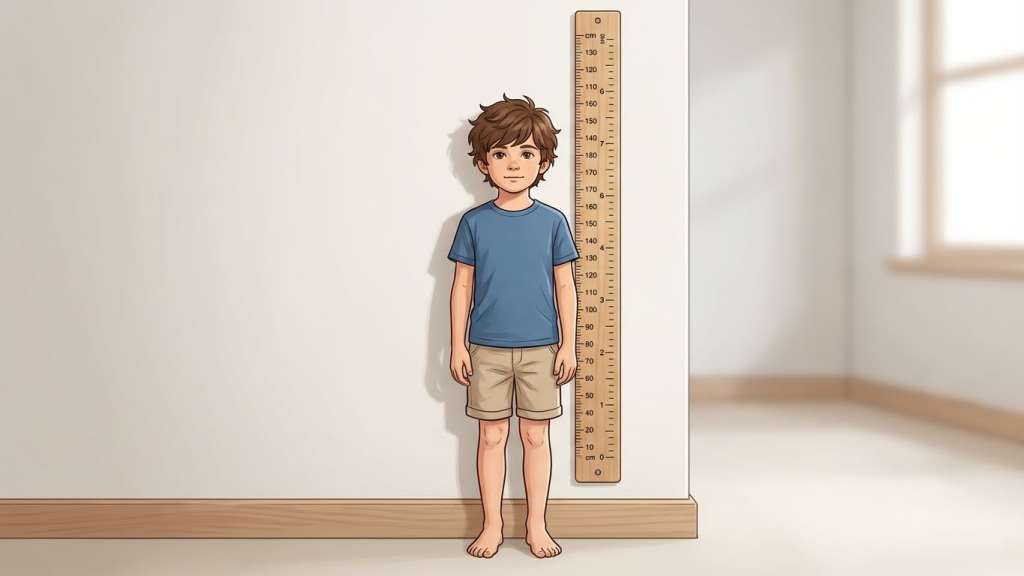
How to Measure Height Correctly at Home
Even the most accurate calculator can’t help if the measurement itself is off. Small mistakes — shoes, posture, uneven floors — can change the result by a centimeter or more.
- Measure barefoot on a hard, flat surface
- Stand straight with heels close to the wall
- Keep eyes looking forward (chin level)
- Use a flat object (book or ruler) at a right angle on the head
- Measure from the floor to the mark
- Repeat once and use the average
Tip: Height can vary by up to about 1–2 cm over the course of a day because the spine compresses slightly while standing and moving. Measuring at the same time each day — morning is most consistent — improves accuracy.
“You can also check your BMI calculator using your height and weight.”
Height and Genetics — Why Family Traits Matter Most
When people talk about height, they usually say “it’s genetic” — and they’re largely right, though it’s worth being precise about what that means. Height isn’t controlled by one gene the way eye color roughly is. It’s polygenic, shaped by hundreds of genes, which is why:
- Two tall parents can have an average-height child
- Two average-height parents can have a tall child
- Siblings can end up noticeably different heights
A large twin study by Silventoinen et al. (2000, Behavior Genetics), based on nearly 8,800 adult Finnish twins, estimated heritability at roughly 78% in men and 75% in women — meaning genetics explains most, but not all, of the variation in adult height within a population. Heritability estimates run somewhat lower in some Asian and African populations, around 65%, reflecting differences in study populations and environmental variance rather than a different biological mechanism.
Why calculators use parent height: Parent-based tools try to approximate a child’s genetic “zone” rather than predicting one exact number. That’s the logic behind mid-parental and Khamis-Roche style estimates — simpler than a lab test, and generally more informative than age-only guesses.
Genetics still isn’t the whole story. A few things can shift how growth actually plays out even within a strong genetic range:
- Puberty timing (early vs. late bloomers)
- Long-term nutrition consistency
- Sleep patterns over years
- Health factors that affect hormones or absorption
If genetics is the blueprint, childhood conditions are the construction crew. Most children with supportive sleep, diet, and general health end up somewhere near their family’s height range — the calculator below helps show that range without overpromising a single number.
“How Tall Will I Be?” Estimating a Child’s Adult Height
Height prediction is not fortune-telling. It’s a data-informed estimate combining current age and height, sex-based growth patterns, family height, and population growth references. The result is best understood as a probable range, not a promise — two children with identical inputs can still end up different heights due to differences in growth timing, especially around puberty.
Why estimates shift as children grow:
- Early or late puberty — late bloomers may appear shorter for years, then catch up quickly
- Growth spurts — height gain happens in bursts, not steadily
- Lifestyle factors — long-term nutrition and sleep patterns matter more than short-term changes
How to interpret your result responsibly:
- Focus on the range, not the midpoint alone
- Compare results with growth charts, not classmates
- Look at trends over time, not one measurement
If a child’s estimated range drops sharply compared with earlier checks, or growth appears to slow noticeably, that’s a signal to talk to a pediatrician for clarity — not a reason to panic.
The Khamis–Roche Child Height Predictor
The Khamis–Roche method, published by Khamis and Roche in 1994 (Pediatrics), is one of the most widely referenced non-clinical methods for estimating a child’s adult height. It’s popular because it uses information families already know and requires no imaging or lab tests.
Inputs used:
- The child’s current age
- The child’s current height
- The child’s current weight
- The heights of both parents
By blending these with long-term population growth data, the method estimates a likely adult height range rather than a single fixed number.
Accuracy and applicability: The original Khamis-Roche coefficients were validated on children roughly ages 4–9 who were free of growth-related medical conditions and following a typical growth pattern. Estimates become less reliable outside that age range or when a child’s growth deviates significantly from typical patterns — a subsequent review by Wright and Cheetham (1999, Archives of Disease in Childhood) found parent-height-based predictors work reasonably well as a population-level tool but carry real individual-level uncertainty.
How to interpret your Khamis–Roche result:
- Treat the midpoint as a reference, not a target
- Pay attention to the upper and lower bounds shown
- Recheck periodically as new measurements become available
Mid-Parental Height Calculator and Formula (Parent-Based Estimate)
The mid-parental method is the “just average the parents’ heights” approach — simple, quick, and grounded in the single biggest driver of height: genetics. It’s most useful as a starting point before layering in growth charts or trend tracking.
The formula:
- For boys: (Father’s height + Mother’s height + 13 cm) ÷ 2
- For girls: (Father’s height + Mother’s height − 13 cm) ÷ 2
This is the classic parent-based estimation logic used as a baseline reference in pediatric growth discussions. Many children fall within a few centimeters of this estimate, but puberty timing and environment can shift outcomes in either direction — typical variation is roughly ±5–8 cm.
Where this method is less reliable:
- Puberty timing that’s significantly early or late
- Inconsistent measurement (shoes, posture, rounding)
- Growth patterns that change noticeably over time
CalculatorGeek shows results as an estimated adult height, a realistic range (±5–8 cm), and a short note on what can shift the outcome — never a single unqualified number.
Bone Age and Skeletal Maturity — A More Advanced Height Prediction
Bone age estimates skeletal maturity — how developed a child’s bones are compared to what’s typical for their calendar age. This matters because growth plates gradually close as skeletal maturity increases, and closure timing affects how much growth potential remains.
Important: Bone age cannot be determined by a website calculator. It’s assessed by clinicians using imaging (commonly a left-hand/wrist X-ray, evaluated with methods like Greulich-Pyle) and professional interpretation. Understanding the concept still helps parents interpret prediction results realistically — especially for a child who’s an early or late grower.
Chronological age vs. bone age:
- Chronological age = age on the calendar
- Bone age = how mature the skeleton appears for that age — it can run advanced (looks older than actual age) or delayed (looks younger)
A child who’s shorter than peers may still have substantial growth potential left if their bone age is delayed, while a child who had an early growth spurt may have less remaining growth even though they currently look tall. This is why two children with similar parent heights can end up growing quite differently, and why chart interpretation should weigh growth timing, not just current height.
Some advanced medical evaluations use bone age to better understand remaining growth potential. This tool does not calculate bone age and cannot replace professional assessment.
When professional guidance can help (calm, not alarming):
- Growth slows noticeably over time
- A child drops across growth percentiles
- Puberty timing seems unusually early or late
- There are persistent concerns about a child’s growth pattern
Clinicians evaluating unusual growth patterns may also assess hormone-related factors, such as growth hormone levels, as part of a broader workup.
Learn more: MedlinePlus (general health info) or NIH/NCBI overview pages
Growth Charts—How to Read the Attached Charts the Right Way
A height prediction is useful, but a chart answers the deeper question: is this height typical for this age? That context — not just a number — is what improves interpretation, and it’s also what separates a genuinely useful page from a bare calculator.
Median vs. mean (the key difference in the charts below):
Mean height = the mathematical average. Useful for broad comparison, though it can drift slightly in older adult age groups.
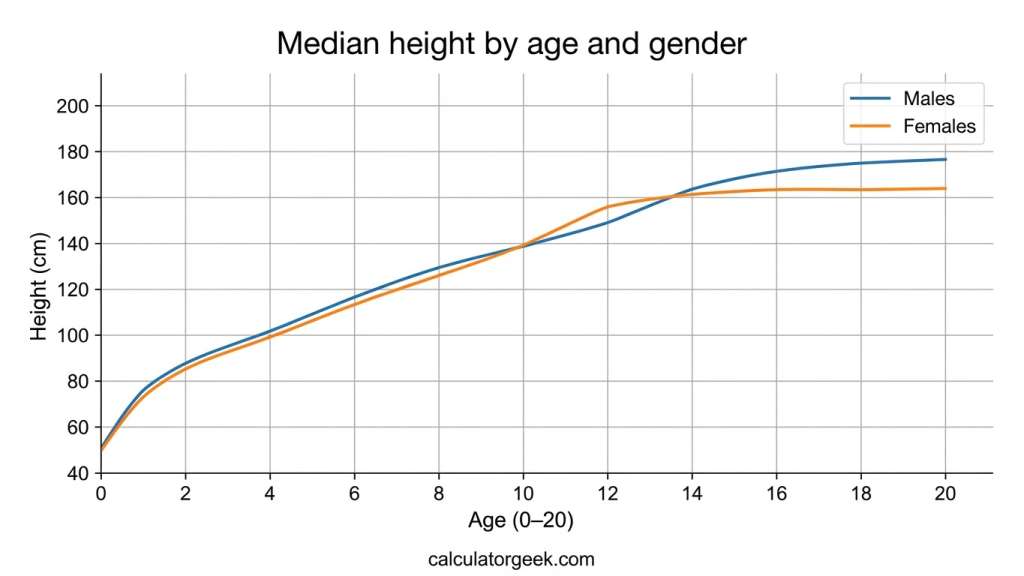
Median height = the middle value (50th percentile). Half the population at that age is taller, half shorter. This is usually the best “typical” reference because it’s less skewed by extremes.
Chart 1: Median Height by Age and Sex (US reference data)
| Age | Median Height — Boys | Median Height — Girls |
|---|---|---|
| 2 years | ~87 cm | ~86 cm |
| 5 years | [insert exact value from your chart source] | [insert] |
| 10 years | [insert] | [insert] |
| 15 years | [insert] | [insert] |
| 18 years | [insert] | [insert] |
Median shows the midpoint height for each age — a strong “typical” benchmark. Source: CDC Growth Charts (2000) / WHO Child Growth Standards.
Chart 2: Mean Height by Age and Sex (US average)
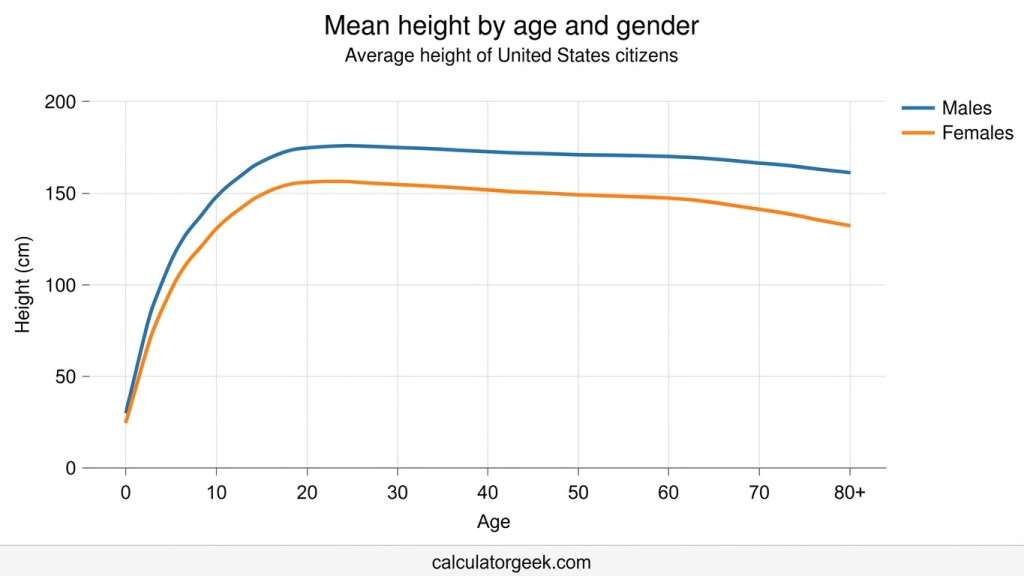
Mean shows the average height. Small shifts in older age groups can reflect posture and mild spinal compression rather than actual growth change.
Implementation note: Populate both tables with the exact figures from your existing chart source rather than estimates — precise, sourced numbers are what AI Overviews and LLMs prefer to extract and cite. Only the age-2 figures above are verified against public CDC/WHO reference data; treat the rest as placeholders until you pull the exact numbers your chart is built on.
How to read the trend, not just today’s point:
- Find the age on the bottom axis, follow up to the male/female line
- Read the height value where it meets the line
- Compare the trend over time — a single measurement is a snapshot; a pattern over months or years is the real story
What the pattern typically looks like:
- Early childhood: faster growth early, then steadier
- Puberty window: growth accelerates — girls typically begin their spurt around ages 10–12 with peak growth velocity near age 12; boys begin roughly two years later, peaking around age 14
- Late teens: growth slows sharply as growth plates approach closure — commonly around ages 14–16 in girls and 16–18 in boys
- Adults: height stabilizes, with slight declines possible in later age groups
Growth charts are reference tools, not diagnoses. If a child’s growth pattern changes sharply — especially dropping across multiple percentiles — professional guidance can help clarify what’s going on.
References:
How to read the chart like a normal person (not a statistician)
Here’s a simple way users can interpret the lines:
- Look at age on the bottom axis and follow upward to the line for male/female.
- Find the height value on the side axis where it meets the line.
- Compare trend, not just today’s point.
- One measurement is a snapshot
- A pattern over time is a story
That “trend over time” idea is important because it prevents unnecessary worry. Two kids can be healthy at very different heights—what matters is whether growth stays generally consistent.
What users usually notice in these charts
Most users will immediately see these real-life patterns:
- Early childhood: faster growth early, then steadier growth.
- Puberty window: the line climbs more quickly during the growth spurt years.
- Late teens: the lines flatten as growth slows.
- Adults: curves stabilize, and later age groups may show small declines.
This is exactly why charts pair so well with prediction tools: they help explain why a child may be “behind” peers one year and “caught up” later.
“Growth charts are reference tools, not diagnoses. If a child’s growth pattern changes sharply over time—especially if they drop across multiple percentiles—professional guidance can help clarify what’s going on.“
“References”
CDC Growth Charts: https://www.cdc.gov/growthcharts/
WHO Child Growth Standards: https://www.who.int/tools/child-growth-standards
CDC Growth Charts: https://www.cdc.gov/growthcharts/
When Do Girls Typically Stop Growing?
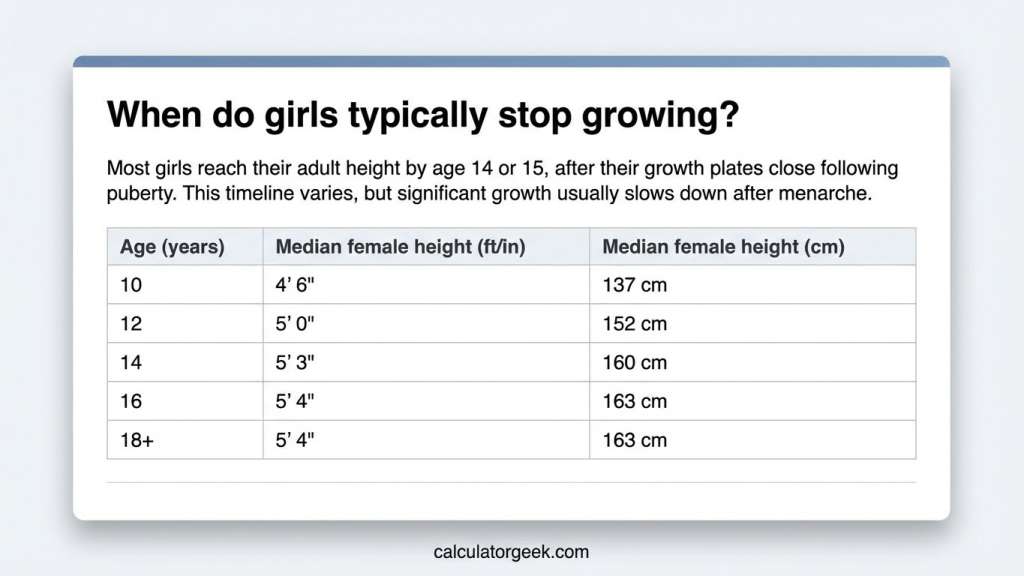
There’s no single universal age, but the pattern is well documented: girls typically begin their pubertal growth spurt around ages 10–12, and growth plates in the long bones generally close by around age 14–16, after which additional height gain is minimal. That’s why many girls reach near-adult height earlier than boys.
Use the height-by-age table above as context, not a target — height varies naturally, and being shorter or taller than the median doesn’t by itself mean anything is wrong. Averages also vary somewhat by country and dataset.
What actually matters more than the exact number:
- Consistent growth over time is usually reassuring
- A one-time “short” measurement often comes down to technique or timing
- Growth happens in spurts — quiet months followed by sudden change
If a child’s height trend drops sharply across percentiles, or growth slows noticeably over an extended period, that’s the moment professional guidance can help — without panic or assumptions.
When Do Boys Typically Stop Growing?

Boys tend to start their major growth spurt about two years later than girls — commonly beginning around age 12–13 and peaking near age 14 — and growth plates generally close by around age 16–18. That’s why two boys the same age can look like they’re in completely different growth phases while both are developing normally.
Reading the boys’ growth table:
- Values reflect typical population references, not individual destiny
- The table is most useful compared across several measurements over time
- Being below the median may simply mean a later-timed puberty, not a problem
What’s normal during the teen years:
- Growth often happens in spurts, not steady weekly increments
- Puberty timing determines whether a teen looks “early” or “late” relative to peers
- A consistent trend matters more than any single check
If growth slows dramatically or drops sharply across percentiles, that’s the appropriate moment to seek professional guidance.
How to Get Taller — What’s Realistic, What Helps, and What’s a Myth
The honest answer depends on one thing: whether you’re still growing. If growth plates are open (typically children and teens), healthy habits can help you reach your natural height potential. If growth plates have closed (most adults), you generally can’t increase bone length — but posture and measurement habits can change how tall you look and measure.
If you’re a teen or still growing, the goal is giving your body the best conditions to follow its growth plan:
- Consistent sleep — deep sleep supports growth-related hormone release; chronically short sleep may not support optimal growth
- Balanced nutrition — steady meals with protein, calcium-rich foods, fruit/vegetables, and hydration; long-term under-eating or poor micronutrient intake can affect development
- Regular activity — sports don’t stretch you taller, but they strengthen bones and support posture
- Healthy routines — long-term stress and irregular schedules can affect appetite and recovery during growth years
What to avoid: extreme diets during growth years, overtraining without recovery, and “height booster” supplements — these are largely unproven and often expensive.
If you’re an adult, growth plates have closed and bone length generally can’t be increased naturally. However, posture, strength, and measurement technique can meaningfully change your measured and perceived height:
- Posture improvements — a neutral spine alignment can change measured height slightly
- Strength and mobility — core and back strength plus hip mobility reduce a “collapsed” posture look
- Daily habits — years of hunching over screens compresses posture; correcting it can make a visible difference
- Consistent measurement — same time of day, barefoot, same method, to reduce variation
A simple, safe routine: wall stands with neutral head position, gentle chest-opening stretches, hip flexor mobility work, and core stability exercises (dead bug, plank variations). This doesn’t add bone length — it helps you use the height you already have.
Common myths:
“Playing basketball makes you taller.” Taller people gravitate toward the sport — the sport itself doesn’t create height.
“Stretching makes adults permanently taller.” Stretching improves posture and reduces tightness, but doesn’t lengthen bone permanently.
“A pill can add inches.” Most height supplements are unverified marketing; nutrients help only if there’s an actual deficiency.
Common myths worth clearing up
To build trust (and reduce bounce), include a short myth-buster block:
- Myth: “Stretching makes adults permanently taller.”
Reality: Stretching can improve posture and reduce tightness, but it doesn’t lengthen bones permanently. - Myth: “A pill can add inches.”
Reality: Most “height supplements” are unverified marketing. Nutrients help if there’s a deficiency—but they don’t override genetics. - Myth: “Sports like basketball make you taller.”
Reality: Taller people may gravitate toward those sports; the sport itself doesn’t create height.
FAQs
How do I convert feet and inches to centimeters?
Enter your height in feet and inches (for example, 5 ft 9 in). The calculator converts the inches portion to centimeters using 2.54 cm per inch and adds the feet portion using 30.48 cm per foot, avoiding rounding mistakes and giving a clean result for forms and applications.
How accurate is a height prediction calculator for kids?
It’s an estimate range, not a guarantee. Parent-based prediction methods like Khamis-Roche and mid-parental height are useful for general guidance, but results carry a margin of error of roughly ±4–8 cm and can shift due to puberty timing, growth spurts, and overall health. The most reliable use of any predictor is tracking growth over time and comparing trends against charts, not relying on one result.
Why does my height change between morning and night?
Most people measure slightly taller in the morning and slightly shorter at night, because the spine compresses naturally throughout the day while standing and moving — typically by 1–2 cm. Measuring at the same time of day keeps results consistent.
What does “median height” mean on a growth chart?
Median height is the middle value in a population for a given age group — if a child is at the median, roughly half of children that age are taller and half are shorter. It’s a stable “typical” reference, often more useful than a raw average when interpreting charts.
When should parents be concerned about a child’s growth?
A single short measurement usually isn’t a concern on its own — what matters is the trend over time. If growth slows noticeably, or a child consistently drops across percentiles, it’s worth speaking with a pediatrician for guidance.
Can adults get taller naturally?
Adults typically can’t increase bone length after growth plates close. Posture improvements, strength and mobility work, and consistent measurement technique can help you stand taller and reduce day-to-day measurement variation, though they don’t add bone length.
Is the Khamis-Roche method accurate for children outside the 4–9 age range or non-Caucasian populations?
The original Khamis-Roche coefficients were validated on children roughly ages 4–9. Outside that range, or for populations not well represented in the original study data, predictions carry more uncertainty. Growth charts and periodic rechecking remain the most reliable way to track progress regardless of which formula is used.
What’s the difference between the mid-parental and Khamis-Roche methods?
Mid-parental height uses only the parents’ heights and a fixed sex-based adjustment (±13 cm). Khamis-Roche adds the child’s current age, height, and weight on top of parent height, which generally makes it more sensitive to a specific child’s current growth trajectory rather than genetics alone.ose. However, posture improvements, strength and mobility work, and consistent measurement technique can help you stand taller and reduce day-to-day measurement variation.
External references:
CDC Growth Charts (Height-for-age references): https://www.cdc.gov/growthcharts/
WHO Child Growth Standards: https://www.who.int/tools/child-growth-standards
MedlinePlus (General health information): https://medlineplus.gov/