
Percent Error Calculator
Calculate percent error between an observed (measured) value and a true (accepted) value. Results update automatically as you type.
People used this calculator
Your current platform: —
Global counter (server-side).
Percentage Error Calculator (Formula, Steps, and Examples)
A percentage error calculator helps you measure how far an observed (measured) value is from a true (accepted) value, expressed as a percent. It’s a quick way to judge accuracy in labs, homework, quality checks, and everyday measurement comparisons—without getting lost in manual math.
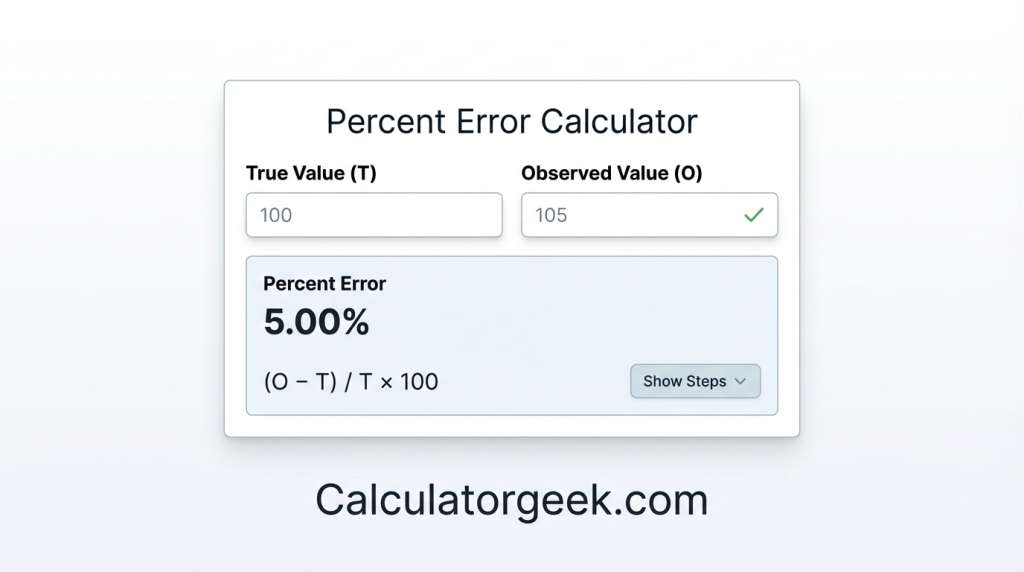
On CalculatorGeek’s Percent Error Calculator, you enter True value and Observed value, and results update automatically as you type. You’ll see the core percent error formula, plus extra outputs like signed percent error (direction), the signed difference, absolute difference, absolute percent error, and relative error as a decimal. You can also reveal step-by-step working, copy outputs, or share a link to the calculation results.
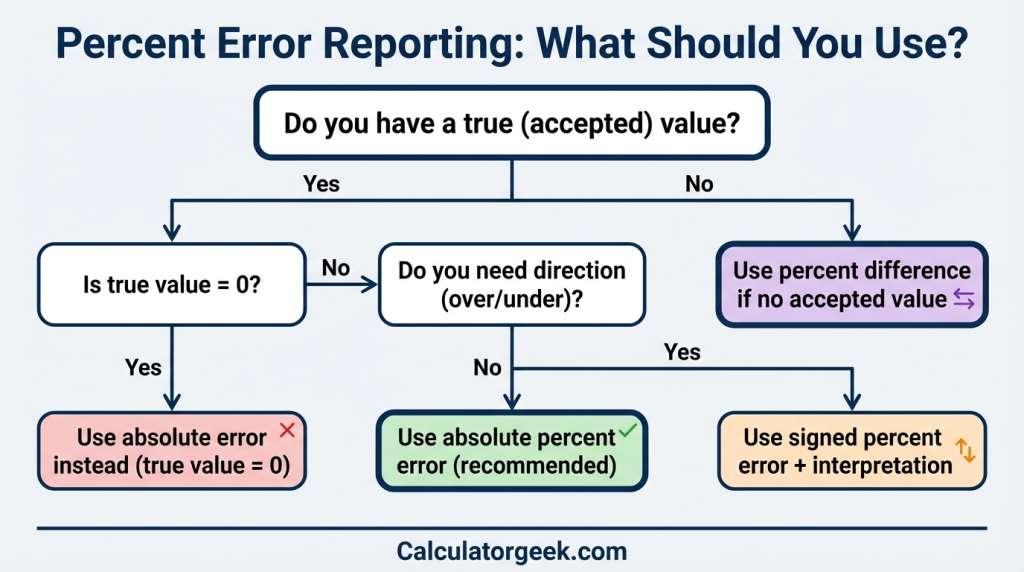
If you want the number to represent “how far off” (without direction), use absolute percent error. If you want to know whether the observed value is above or below the true value, use the signed percent error and the interpretation output.
Percentage Error Calculator:
A percentage error calculator reports the error between your observed value and the true value as a percent of the true value.
What you enter
- True value (T): accepted/reference value
- Observed value (O): measured/experimental value
What you get
- Percent error (signed) for direction
- Absolute percent error for magnitude
- Often also: difference (O − T), |O − T|, and relative error (decimal)
Core idea
- Compare the difference (O − T) to the baseline T, then convert to percent.
Quick example
- T = 100, O = 104 → (104 − 100) / 100 × 100 = +4%
A good percentage error calculator online will also show absolute percent error = 4%.
What Percentage Error Means
Percentage error is a way to express measurement accuracy as a percent, using the true (accepted) value as the baseline.
Definition (plain English)
It answers: “Compared to the true value, what percent higher or lower is my observed value?”
Standard notation
- True value (T): accepted/reference value
- Observed value (O): measured/recorded value
- Difference: O−T
What the sign means
- Positive percent error → the observed value is higher than the true value.
- Negative percent error → the observed value is lower than the true value.
- Zero percent error → perfect match (rare in real measurement).
Why percent error is popular
- It normalizes the same “miss” across different scales.
For example, being off by 2 units matters much more when the true value is 10 than when it’s 1,000.
If you’re measuring how something changes over time from an “old” value to a “new” value (not comparing to an accepted reference), use our Percentage Change Calculator instead.
Percent Error, Margin of Error, and Standard Error
These are different concepts. A percentage error calculator is not a statistics tool.
Percent error (measurement vs accepted reference)
Use percent error when you have:
- an accepted/true reference (T)
- an observed measurement (O)
A percentage error calculator with steps is especially useful for lab reporting.
Margin of error (uncertainty range for an estimate)
Margin of error is common in surveys and polling. It describes a ± range around an estimate from a sample.
Standard error (sampling variability of a statistic)
Standard error describes how a statistic (like a mean) varies across repeated samples.
Quick checklist
- Have true value + measured value → use a percentage error calculator
- Need a confidence band for a survey estimate → margin of error
- Explaining sampling variability → standard error
(For formal measurement reporting terms like accuracy, precision, and uncertainty, authoritative measurement references such as NIST and the GUM are the standard foundations—see References.)
How the Percentage Error Calculator Works on CalculatorGeek
The percentage error calculator on CalculatorGeek is built to reduce common errors (swapped values, wrong baseline, rounding too early) while staying simple.
Inputs (what you type)
- True value (T): the accepted/theoretical/reference value
- Observed value (O): the measured/experimental value
A reliable percentage error calculator depends on this baseline: T must be the denominator.
Formula shown (transparent baseline)
The tool displays the percent error formula so users can confirm the method:
- Percent Error = (Observed − True) / True × 100
This is the standard percent error formula structure when a true reference exists.
Outputs (more than one number)
The CalculatorGeek percentage error calculator provides:
- percent error (signed)
- interpretation (over/under)
- difference (O − T)
- absolute difference |O − T|
- absolute percent error
- relative error (decimal)
This is useful because different teachers, labs, and QA templates ask for different reporting formats.
Steps + reuse features
A percentage error calculator with steps helps when you need to show working. The page also supports “copy output” behavior and re-running calculations quickly after changing inputs, which is a practical workflow benefit.
Percentage Error Formula
The percentage error calculator uses one core relationship: compare the difference between observed and true values to the true value, then convert to percent.
Human-readable formula
Percent error = (how far off you are ÷ the true value) × 100
Standard math form
Let:
- T = true (accepted) value
- O = observed (measured) value
Then:Percent Error=TO−T×100
Why the denominator is the true value
Using T as the denominator answers a specific question:
- “Relative to what the value should be, how large is the error?”
That makes percent error ideal for labs, calibration, and any situation where “true/accepted” is the reference.
Absolute Error Formula
Absolute error is the simplest accuracy measure: it tells you the size of the miss in the original units, not as a percent.
Definition
- Absolute error = |Observed − True|
Using O for observed and T for true:Absolute Error=∣O−T∣
When absolute error is the better choice
Absolute error is often better than percent error when:
- the units matter more than the percent (e.g., “off by 2 mm”),
- you’re comparing errors within the same scale/range,
- the true value is very small (percent can look extreme).
Absolute error vs absolute percent error
- Absolute error → size of miss in units
- Absolute percent error → size of miss as a percent of the true value
Relative Error Formula
Relative error expresses the error as a decimal ratio of the true value. It’s basically percent error before multiplying by 100.
Definition
Relative Error=TO−T
Relationship to percent error
- Percent error = relative error × 100
- Relative error = percent error ÷ 100
Why relative error is useful
Relative error is common when:
- you need a unitless value for analysis,
- you’re comparing accuracy across different magnitudes,
- you’re plugging error terms into other formulas (engineering/science work).
Step-by-Step Percentage Error Calculation
Here’s the same workflow the percentage error calculator follows, written in a way you can reuse in homework, lab notes, or QA documentation.
Step 1: Identify your true and observed values
- True value (T): accepted/reference value
- Observed value (O): measured value
Tip: If you’re using a textbook “accepted value,” that’s your T.
Step 2: Compute the signed difference
Difference=O−T
- If the result is positive, your observed value is higher.
- If it’s negative, your observed value is lower.
Step 3: Divide by the true value (baseline)
Relative Error=TO−T
This converts your raw difference into a scale-free ratio.
Step 4: Convert to a percent
Percent Error=TO−T×100
Step 5 (recommended): Take the absolute value when you only need magnitude
Absolute Percent Error=TO−T×100
Worked example (small and clear)
- True value (T) = 80
- Observed value (O) = 76
- Difference = 76 − 80 = −4
- Relative error = −4 / 80 = −0.05
- Percent error = −0.05 × 100 = −5%
- Absolute percent error = 5%
How to Interpret the Result
The number from a percentage error calculator is easiest to interpret when you separate two ideas:
1) Magnitude vs direction
- Absolute percent error answers: “How far off is the measurement?”
Use this when you only care about accuracy size (common in labs and reporting tables). - Signed percent error answers: “Is the measurement above or below the true value?”
Use this when direction matters (e.g., consistent over-reading vs under-reading).
2) What the sign means (quick rule)
Using TO−T×100:
- Positive percent error → Observed is higher than True
- Negative percent error → Observed is lower than True
On CalculatorGeek, you’ll typically see both the signed difference (O − T) and the absolute difference |O − T| so you can interpret direction and magnitude without re-calculating.
3) “Is this percent error good or bad?”
It depends on context, because acceptable error varies by:
- measurement tool precision (ruler vs sensor),
- required tolerance (classwork vs manufacturing),
- and the size of the true value (small baselines make percent errors look larger).
A practical way to judge it is to compare your absolute percent error to the tolerance or expected uncertainty for your specific task (if one exists), rather than relying on a universal cutoff.
Negative Percentage Error
A negative percentage error is not “wrong” by itself—it simply tells you the observed value is below the true value when you use the standard formula:Percent Error=TO−T×100
What it means (plain English)
- If your percent error is −8%, it means your observed value is 8% lower than the true value.
Why negative percent error happens
Negative values commonly show up when:
- a measurement device reads low (systematic under-reading),
- rounding reduces the observed value,
- a process loses material/energy compared to the expected result,
- or the “true value” is a standard and your sample/measurement falls short.
When to keep the negative sign
Keep the sign when direction matters, such as:
- diagnosing bias (always under-measuring),
- calibration work,
- tracking improvement where “lower than expected” has meaning.
When to remove the sign (recommended for many reports)
If you only need “how far off,” use:
- Absolute percent error
This avoids confusion in tables and summaries, especially when readers interpret percent error as a magnitude.
When to Use Percentage Error
Use a percentage error calculator when you have a reliable true (accepted) value and you want an accuracy check that’s easy to compare across different scales.
Best-fit situations
- Science labs and coursework (accepted/theoretical vs experimental/measured values)
- Calibration checks (device reading vs reference standard)
- Quality control (measured dimension vs spec/target)
- Model validation when a ground-truth reference exists (benchmark vs observed output)
- Any report where “how far off” should be expressed as a percent, not just units
A quick “use it / don’t use it” decision rule
Use percent error if you can confidently answer:
- “What is the true/accepted baseline I should compare against?”
If yes, percent error gives a clean summary, and the tool will also show supportive outputs like difference, absolute difference, absolute percent error, and relative error so you can report results in the format your teacher, lab template, or QA checklist expects.
In many chemistry and physics labs, a percentage error calculator is used to compare an experimental (measured) value to a theoretical (accepted) value.
When Not to Use Percentage Error
A percentage error calculator is the wrong tool when the concept of a single “true value” doesn’t apply, or when the true value is too close to zero to behave sensibly.
Don’t use percent error when…
You don’t have a true/accepted baseline
If you’re comparing two measurements with no accepted reference (A vs B), percent error can be misleading because the choice of baseline changes the result. In that case, use a symmetric comparison method (like percent difference) rather than “error.”
If you don’t have an accepted “true” value and you’re comparing two values (A vs B), use our Percent Difference Calculator to get a symmetric comparison that doesn’t depend on which value you treat as the baseline.
The true value is zero (or effectively zero)
The formula divides by T, so:
- If T = 0, percent error is undefined.
- If T is extremely small, percent error can look huge even for tiny differences.
This is one of the most important edge cases to check before trusting the percent result.
You’re dealing with sampling uncertainty, not measurement error
If your “error” is actually about how much an estimate varies across samples, you’re in standard error / margin of error territory (statistics), not percent error.
You need a tolerance in units, not percent
In many real tasks (cutting, machining, fitting), acceptable variation is set in mm/inches/grams, not as a percent. Absolute error is often the clearer metric there.
Common Mistakes and Edge Cases
This section is written to prevent the most common “looks right but is wrong” outcomes when using a percentage error calculator.
Mistake 1: Swapping true and observed values
The denominator must be the true value (T):
- Correct: (O−T)/T×100
- Wrong: (T−O)/O×100 or dividing by observed
Fix: Always label your numbers first: T = accepted, O = measured.
Mistake 2: Forgetting the sign (or using the wrong sign)
- If you keep the sign, percent error tells direction (over vs under).
- If you don’t need direction, report absolute percent error to avoid confusion.
Fix: Decide up front whether your report expects direction.
Mistake 3: Treating percent error as “percent difference”
Percent error uses a true value baseline.
Percent difference is usually symmetric (uses an average baseline). If you’re comparing two measurements with no accepted value, percent difference is often the better fit.
Fix: Ask: “Do I have an accepted reference?” If not, don’t force percent error.
Mistake 4: Using percent error when the true value is 0
If T = 0, the calculation is undefined.
If T is very small, the percent can be disproportionately large.
Fix: Use absolute error, or a domain-specific metric when the baseline is near zero.
Mistake 5: Rounding too early
Rounding the difference or ratio too soon can shift the final percent.
Fix: Keep 3–6 decimal places in intermediate steps, then round the final output.
Mistake 6: Not matching units
If T is in grams and O is in kilograms, the calculation will be wrong even though the formula is correct.
Fix: Convert units first. Only compare like-with-like.
Mistake 7: Misreading “accepted value”
Sometimes the “true” value is actually:
- a theoretical model output,
- a manufacturer spec,
- a reference instrument reading,
not a perfect truth.
Fix: Document what your “true value” represents. If it’s a reference standard, say so.
Edge case checklist (fast)
- True value not zero ✅
- Units match ✅
- T = accepted, O = measured ✅
- Decide signed vs absolute ✅
- Round at the end ✅
Percentage Error Calculator Examples
These examples show how a percentage error calculator behaves in the most common “accepted vs measured” scenarios. (I’m using T = true value and O = observed value.)
Example 1: Observed value is higher than true (positive percent error)
- T = 50, O = 54
- Difference = 54 − 50 = +4
- Percent error = (4 / 50) × 100 = +8%
Interpretation: measured value is 8% higher than the accepted value.
Example 2: Observed value is lower than true (negative percent error)
- T = 200, O = 188
- Difference = 188 − 200 = −12
- Percent error = (−12 / 200) × 100 = −6%
Interpretation: measured value is 6% lower than the accepted value.
Example 3: Same difference, different scale (why percent matters)
- Case A: T = 20, O = 22 → difference = 2 → percent error = 10%
- Case B: T = 200, O = 202 → difference = 2 → percent error = 1%
Takeaway: a percentage error calculator helps you compare “how big the miss is” across different magnitudes.
Example 4: True value near zero (edge-case warning)
- T = 0.5, O = 0.6
- Difference = 0.1 → percent error = (0.1 / 0.5) × 100 = 20%
Even small absolute differences can become large percent errors when T is very small. That’s why checking the baseline is critical.
Decision Inputs & Outcomes
| Decision you’re making | What you know (inputs) | Best output to report | What it tells you | Common pitfall to avoid |
|---|---|---|---|---|
| You only care “how far off” (no direction) | True value (T) and Observed value (O) | Absolute percent error | Magnitude of the miss as a percent of T | Reporting a negative sign that confuses readers |
| You need direction (over vs under) | T and O | Signed percent error + interpretation | Whether O is above or below T, and by what percent | Swapping T and O (wrong baseline) |
| You must show the raw miss in units | T and O (same units) | Difference (O − T) and/or |O − T| | How many units you’re off (signed or absolute) | Using percent when tolerance is specified in units |
| You’re comparing accuracy across scales | T and O across different magnitudes | Absolute percent error (and keep relative error if needed) | A scale-free measure that’s comparable | Comparing absolute errors from different baselines |
| True value is zero (T = 0) | T = 0, O ≠ 0 | Absolute error (units) or a domain metric | Percent error is undefined; use unit-based error | Trying to divide by zero |
| True value is extremely small | T is near 0 | Absolute error + context, optionally percent | Percent can look huge for tiny unit differences | Overreacting to a large percent created by a tiny baseline |
| You don’t have an accepted “true” value | Two measurements (A and B) only | Use a symmetric comparison (not percent error) | Avoids baseline bias when neither value is “true” | Calling it “error” when it’s really a difference |
Limitations and Disclaimer
A percentage error calculator is a helpful guide, but it can’t decide whether your result is “acceptable” without context. Different fields tolerate different amounts of error, and what counts as “true” can vary (accepted value, spec, reference instrument, or model baseline).
“Tools information on Calculatorgeek is provided for general guidance and educational purposes only.”
Key limitations to keep in mind
- Baseline sensitivity: Percent error depends on the true value (T). Very small T can inflate percentages.
- No universal threshold: A “good” percent error depends on your tolerance, measurement method, and reporting standards.
- Inputs must match: Unit mismatches and swapped values can produce confident-looking but incorrect results.
- True value definition: If your “true” value is a reference estimate (not an absolute truth), report what it represents.
Ad & Content Safety Note
This page is written for general educational use and aims to be safe for broad audiences. Any examples are illustrative only and should be adapted to your own context and standards. Ads, if shown, do not change calculation logic or outputs.
About the Author
Written by: Emily Carter
Credential: M.S. in Applied Mathematics
Role: Editor
Emily Carter writes practical, accuracy-focused tool guides for CalculatorGeek, helping readers use calculators (like the percentage error calculator) correctly and avoid common baseline and unit mistakes. Their work emphasizes clear definitions, step-by-step reasoning, and safe, everyday explanations that work for students, DIY users, and professionals.
FAQs
1) How do I use a percentage error calculator correctly?
Enter the true (accepted) value as T and your observed (measured) value as O. Then read either the absolute percent error (magnitude) or the signed percent error (direction), depending on your goal.
2) What formula does a percentage error calculator use?
Most tools use:
- Percent error = (O − T) / T × 100
This keeps the true value as the baseline.
3) Why is my percentage error negative?
A negative result means your observed value is lower than the true value (because O−T is negative). If you only need “how far off,” report absolute percent error.
4) What if the true value is 0?
Percent error is undefined when T = 0 (division by zero). In that case, use absolute error |O − T| or another unit-based metric appropriate to your field.
5) Should I report signed percent error or absolute percent error?
- Use absolute percent error for most summaries and tables (clear “how far off”).
- Use signed percent error when direction matters (over-reading vs under-reading, calibration bias).
6) Is percent error the same as percent difference?
No. Percent error assumes there is a true/accepted reference value. Percent difference is better when you’re comparing two values without a “true” baseline (it’s often symmetric).
7) Why do I get a different answer than my friend/classmate?
The usual causes are:
- swapped true vs observed values,
- different rounding (rounding too early),
- unit mismatch (cm vs mm),
- or one person reporting signed error while the other reports absolute percent error.
References (authoritative sources)
- **National Institute of Standards and Technology — Concepts of accuracy, precision, and measurement error (foundational definitions used in science/measurement reporting).
- **BIPM / JCGM — Guide to the Expression of Uncertainty in Measurement (GUM): internationally recognized guidance for evaluating and expressing measurement uncertainty.